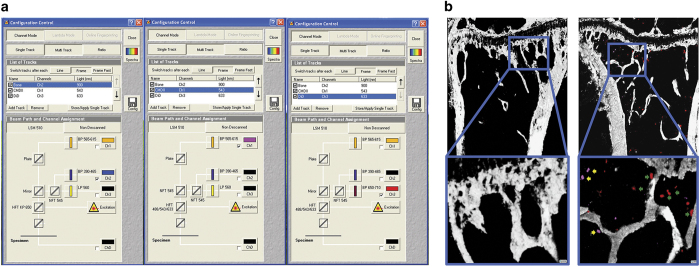
Figure 4.
Configuration settings to scan bone and tumour cells labelled with Vybrant DiD and CM-DiI. Beam paths for the different channels are shown in (a). The bone structure is visualised by second harmonic generation (SHG) using a Chameleon laser at 900 nm with a BP390-465 filter, while Vybrant DiD labelled cancer cells are visualised using a 633 nm HeNe laser with a BP 650–710 filter and Vybrant DiI/CM-DiI is visualised with a 543 nm HeNe laser with a BP 565–615 filter. (b) Mouse tibia scans in which only SHG signals are shown in the tibia of a non-tumour cell bearing mouse (left panel) while breast cancer cells labelled with Vybrant CM-DiI (yellow arrows) and Vybrant DiD (green arrows) are visible in the tibia of a tumour cell bearing mouse (right panel).

