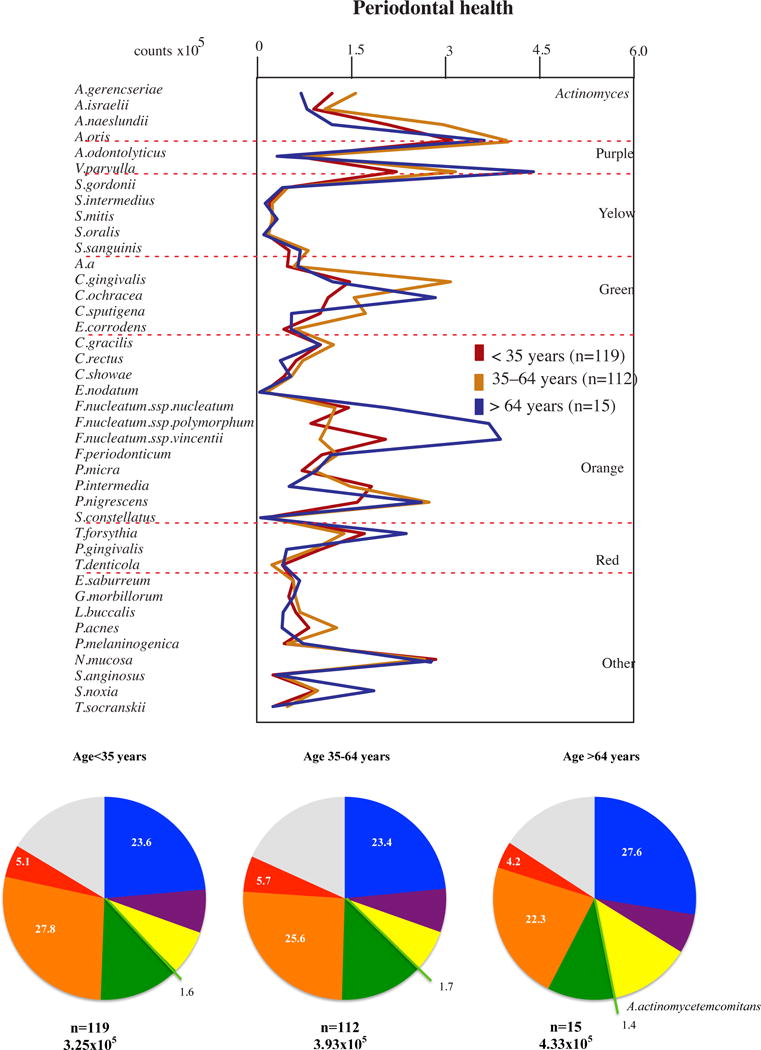
Figure 1.

Profiles of the mean counts (×105) and of the mean proportions of 40 taxa in subgingival biofilm samples taken from 246 subjects with periodontal health subset into three age groups (<35, 35–64 and >64 years of old). Nine subgingival biofilm samples were taken from each subject and were analyzed separately to determine their content of the 40 species of bacteria. The species were ordered and grouped according to the microbial complexes described by Socransky et al. [89]. The mean values for each species were averaged within a subject and then across subjects in each age group. The colors in the pie charts represent the different complexes. Actinomyces spp. are represented in blue and A. actinomycetemcomitans in light green. The grey color represents species that did not fall into any complex. The significance of differences among groups was determined using analysis of covariance (ANCOVA), adjusted for smoking, gender, baseline probing depth and clinical attachment level and geographic population. The significance of differences between pairs of comparisons was determined using Tukey’s multiple comparison test (different letters indicate significant differences between age groups).
