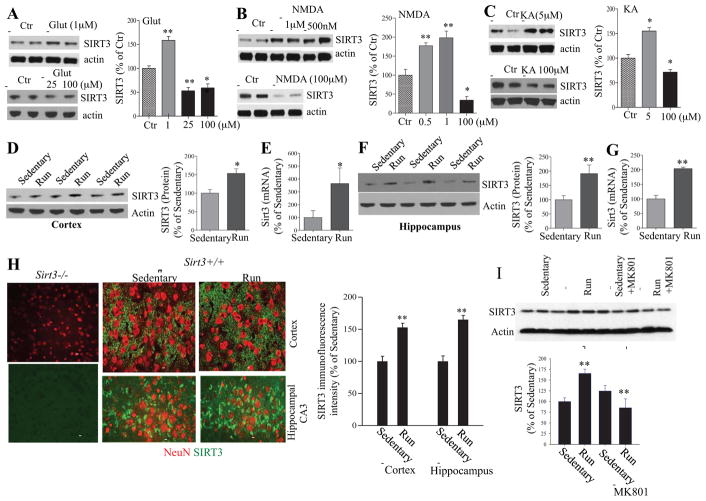
Figure 5. Low levels of glutamate receptor stimulation, and voluntary wheel running, induce SIRT3 expression in brain cells.<.
br>(A – C) Immunoblot analysis of SIRT3 protein levels in primary cortical neurons that had been exposed for 24 hours to vehicle (control) or the indicated concentrations of glutamate (Glut), kainate acid (KA) or NMDA. Each lane is a sample from an individual culture, and quantitative data include results of three separate experiments. Values were normalized to the actin level in the same sample, and values are expressed as percentage difference from the value for vehicle control cultures. *p<0.05 and **P<0.01 (ANOVA with Student Newman–Keuls post-hoc tests). (D – G) Immunoblot analysis of SIRT3 protein levels (D and F) and quantitative RT-PCR analysis of Sirt3 mRNA levels (E and G) in cerebral cortical (D, E) and hippocampal (F, G) tissues of wild type mice that were maintained for one month without (sedentary) or with running wheels in their cages. Values for SIRT3 protein and Sirt3 mRNA were normalized to actin protein or mRNA, respectively. Values are expressed as a percentage of the average value for sedentary mice and are mean ± SEM (n= 6–8 mice). *p < 0.05 and **p <0.01 (Student’s t-test). (H) Representative confocal images of double-label fluorescence staining of brain sections with a SIRT3 antibody (green) and NeuN (red) showing cerebral cortex of Sirt3−/− and Sirt3+/+ mice, and the hippocampal CA3 region in both sedentary and runner mice. Bar = 50 μm. The results of SIRT3 immunofluorescence intensity quantification are shown in the graph. The mean value in areal bins in the cortex (100 x 100 μm) and hippocampal CA3 region (50 x 100 μm) are expressed as a percentage of the mean value for sedentary mice (mean ± SEM; n= 4 mice). **p <0.01 (Student’s t-test). (I) Immunoblot analysis of SIRT3 in samples of hippocampal tissues of Sirt3+/+ and Sirt3−/− sedentary or running mice that received intraperitoneal injections of saline (control condition) or 0.5 mg/kg of the NMDA receptor antagonist MK80l once daily for 1 week. Sirt3 levels (densitometry analysis) (right panel) were normalized to actin protein levels and expressed as a percentage of the value for Sirt3+/+ sedentary mice. Values are mean ± SEM (n= 6 mice). **p <0.01.

