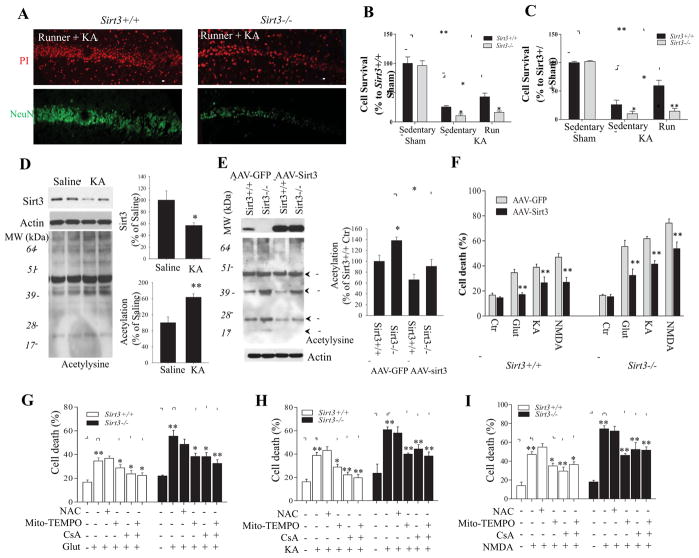
Figure 7. SIRT3 deficiency abolishes the excitoprotective effect of running, and neuronal vulnerability to excitotoxicity can be ameliorated by Sirt3 gene therapy, a mitochondria-targeted superoxide scavenger and a PTP inhibitor.
(A) Representative confocal images showing NeuN immunostaining (green) and propidium iodide staining (PI; red) in the CA1 region of the hippocampus of Sirt3+/+ and Sirt3−/− mice that had been running for 30 days prior to, and for 7 days after, administration of KA. (B and C) Results of counts of undamaged neurons remaining in regions CA1 (B) and CA3 (C) of Sirt3+/+ and Sirt3−/− mice that had been maintained for 30 days without (sedentary) or with running wheels in their cages prior to intra-hippocampal infusion of KA, or sham surgery. Values are mean ± SEM (n= 5 mice per group). *p < 0.05, **p <0.01. (D) Immunoblot of SIRT3 and acetylysine in the hippocampal tissues from Sirt3+/+ mice after 24 h saline or KA stereotaxic injections. Actin was used as a loading control. (E) Immunoblot analysis of SIRT3 protein levels and protein acetylation levels in wild type cortical neurons 72 h after infection with AAV-GFP or AAV-Sirt3-IRES-GFP. The SIRT3 protein level and total acetylated protein levels (densitometric analysis) (graphs in panels D and E) are normalized to actin protein levels and expressed as percentage of the value for Sirt3+/+ mice. Values are mean ± SEM (n = 4 mice). *p < 0.05, **p <0.01. (F) Results of quantitative analysis of cell death in cultures of Sirt3+/+ and Sirt3−/− cortical neurons that had been infected with AAV-GFP or AAV-Sirt3-IRES-GFP) for 3 days and then exposed for 24 hours to glutamate, KA or NMDA (200 μM each). Cell death was quantified as described in the Figure 1 legend. (G – I) Sirt3+/+ and Sirt3−/− cortical neurons were pretreated with the indicated agents and then exposed to 200 μM glutamate (G), KA (H) or NMDA (I) for 24 hours. Cell death was quantified as described in the Figure 1 legend. NAC, N-acetyl-L-cysteine (1 mM); mitoTEMPO, a mitochondrial superoxide scavenger (1 μM); CsA, the mitochondrial PTP inhibitor cyclosporin A (1 μM). Values are mean ± SEM (separate cultures from 4 or 5 mice; 6 images per culture were analyzed). *p<0.05 and **P<0.01.

