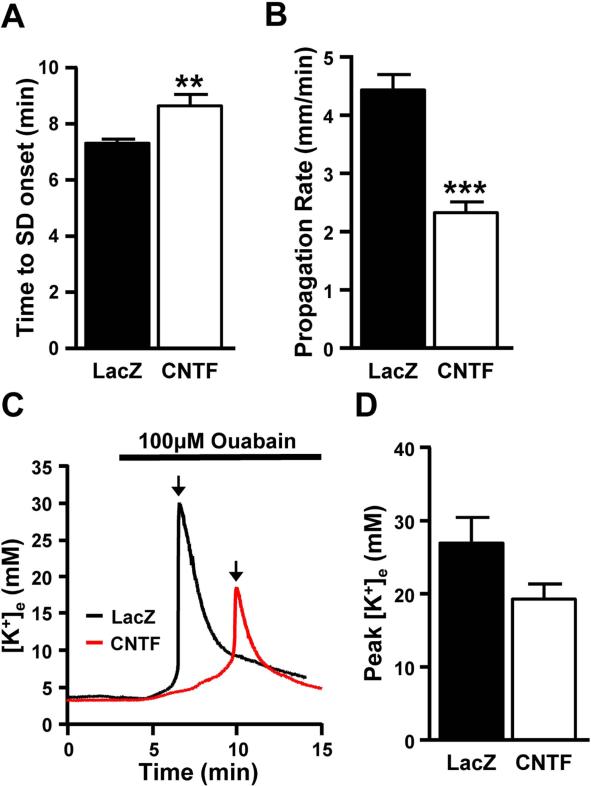
Figure 5. Contribution of Na+/K+-ATPase pump in the reduced susceptibility to SD of CNTF tissues.
During 100 μM ouabain exposures, both electrical recordings and intrinsic optical signals were used to measure SD in the sr of the CA1. A. Although SD could be induced in all CNTF preparations (n=12), the latency to SD was significantly longer when compared to LacZ controls (n=12) (t(22)=3.12, **p=.005, independent t-test). B. The rate of propagation was also significantly slower in CNTF preparations when compared to LacZ slices (n=12, t(22)=6.53, ***p<.0001, independent t-test). C. Examples of K+ responses (in mM) from a LacZ preparation (black) and a CNTF preparation (red) during SD induced by 100 μM ouabain. Black arrows indicate SD onset. D. Extracellular changes in K+ were measured during ouabain-induced SD. While not significant, there was a trend towards a decrease in the peak concentration of extracellular K+ in CNTF preparations compared with LacZ controls (n=12, (t(22)=1.887, p=.0724, independent t-test)).

