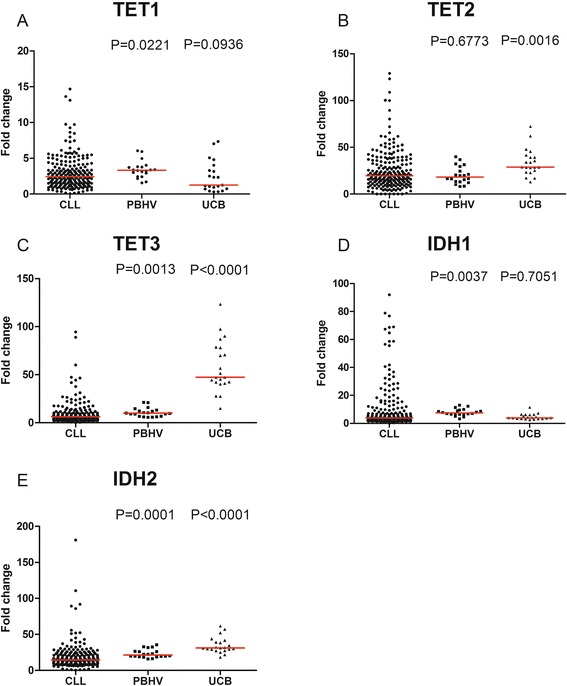
Fig. 1.

TET and IDH mRNA expression in CLL and control samples. Fold changes in mRNA expression of a TET1, b TET2, c TET3, d IDH1, and e IDH2 in CD19 purified cells from 214 CLL, 20 peripheral blood of healthy patients (PBHV) and 21 umbilical cord blood (UCB) samples are displayed with median (red). Statistical differences are indicated in relation to CLL and were assessed using the Mann–Whitney non-parametric test
