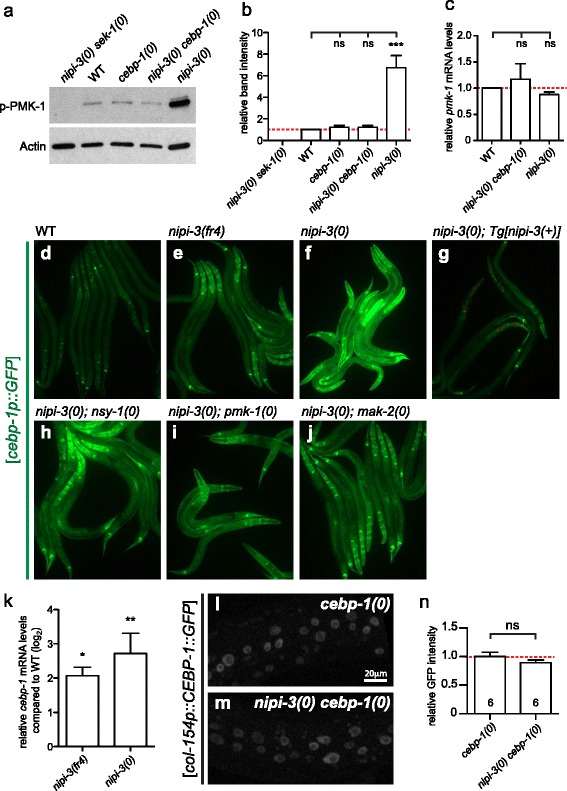
Fig. 3.

NIPI-3 represses PMK-1 phosphorylation via cebp-1 and represses cebp-1 transcription. a Western blot analysis on total protein lysate from various animal strains using the indicated antibodies, α-phospho-p38 MAPK antibody to detect a phosphorylated form of PMK-1 proteins (p-PMK-1) or α-actin antibody as a loading control. b Densitometric quantifications of immunoblot signals normalized to actin. n = 3; error bars represent standard error of the mean (SEM); *** P < 0.001 (one-way ANOVA with Tukey’s post hoc tests). c Quantitative RT-PCR (qRT-PCR) analysis of pmk-1. Relative abundance of pmk-1 mRNA normalized to actin mRNA. n = 3; error bars represent SEM; ns, not significant (one-way ANOVA with Tukey’s post hoc tests). d–j Fluorescence images of cebp-1p::GFP reporter animals at L2. k qRT-PCR analysis of cebp-1 in WT, nipi-3(fr4), nipi-3(0) animals. Relative abundance of cebp-1 mRNA normalized to actin mRNA. n = 3; error bars represent SEM; *P < 0.05; **P < 0.01; ns, not significant (one-way ANOVA with Tukey’s post hoc tests). l, m Confocal fluorescence images (z-stack) of col-154p(epidermis)::CEBP-1::GFP reporter animals at L2. n Quantification of GFP intensity measured in each epidermal nucleus (10 per animal). n = 6; error bars represent SEM; ns, not significant (Student’s unpaired t test). Primary data for panels (b, c, and k) are provided in Additional file 14
