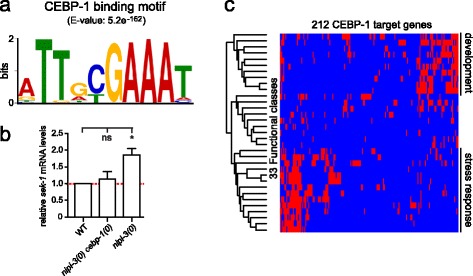
Fig. 5.

CEBP-1 binds conserved DNA motifs in genes regulating development and stress response. a Motif logo of the most over-represented motif among CEBP-1 ChIP-seq peaks. b qRT-PCR analysis of sek-1. Relative abundance of pmk-1 mRNA normalized to actin mRNA. n = 3; error bars represent SEM; *P < 0.05; ns, not significant (one-way ANOVA with Tukey’s post hoc tests). Primary data are provided in Additional file 14. c Hierarchical clustering of genes and functional classes (see Additional file 10: Figure S9 and Additional file 8: Table S1 for class labels and full data); the presence of a gene in a class is represented by a red rectangle, its absence by blue
