Figure 2.
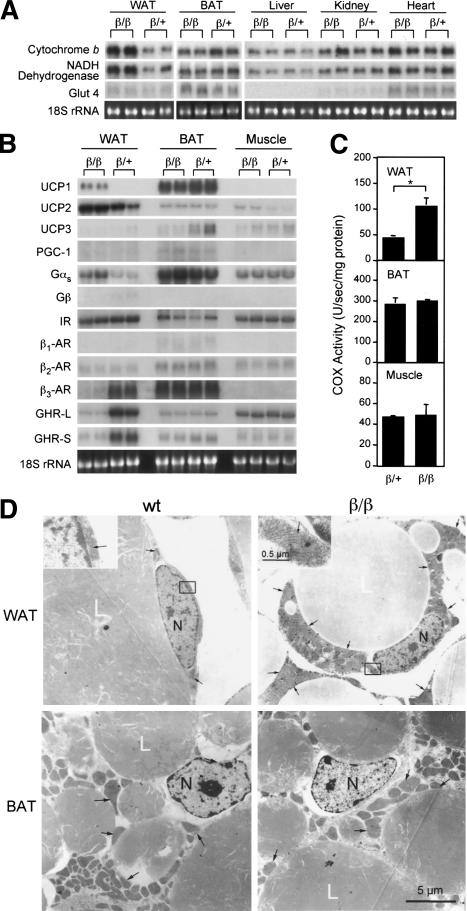
Mitochondria-enriched WAT and increased expression of genes encoding factors involved in energy oxidation in WAT of β/β mice. Northern blot analyses of enzyme genes involved in mitochondrial Electron Transfer Chain (A) and regulators (B) in tissues of β/β mice. Each lane contains 10 μg RNA from an individual animal. (C) Cytochrome c oxidase (COX) activity of tissue extracts of β/β mice. Each bar represents the mean ± S.E.M. (n = 5). (*) p < 0.05 between the two groups of mice indicated. (D) Electron micrograph of adipocytes from epididylmal (WAT) and brown adipose tissues (BAT) of 4-week-old β/β mice. Top windows show a higher magnification of the rectangle-enclosed area on the WAT micrograph. (L) lipid droplets; (N) nucleus. Black arrows indicate representative mitochondria.

