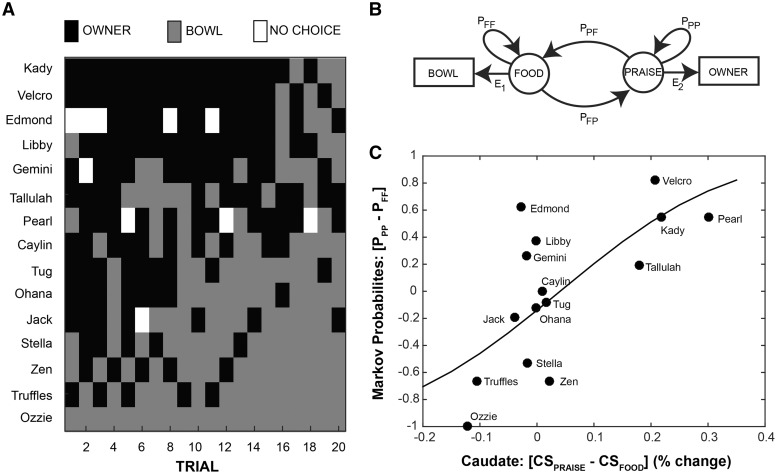
Fig. 4.
Hidden Markov model and logistic regression of neural vs behavioral preference. (A) Y-maze choice sequences for each participant on each of the 20 test trials. (B) A schematic representation of the hidden Markov model used to compute transition probabilities between food bowl and owner in the behavioral Y-maze task (Experiment 3). ‘Food’ and ‘Praise’ represent the internal states associated with selection of the food bowl ‘Bowl’ and owner ‘Owner’, respectively. E represents emission probabilities, the likelihood of moving from an internal state to the matched behavior. P represents probabilities, for transitioning between states or staying in the current state. (C) A logit function was fit to the relationship between the differential caudate activation to expectation of praise vs food in Experiment 1 (x-axis) and the differential probability of staying with owner vs food in the Markov model (y-axis). To fit the logit model, we first transformed the difference in transition probabilities into an equivalent number of owner/bowl choices, according to: N(PPP − PFF + 1)/2, where N was the total number of trials in which a dog made a choice. The logit model was then fit in R using a probit link function. [Z(13) = 6.24, P < 0.001, null deviance = 93.08, residual deviance = 50.10, chi-square goodness of fit P < 0.001].

