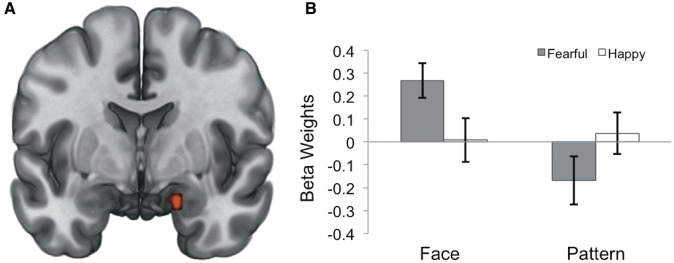
Fig. 2.
(A) Statistical map derived from a 2 × 2 voxelwise analysis of variance model showing right amygdala voxel clusters (red) with a significant target × mask interaction effect (MNI 18, −3, −21; F = 10.55, P < 0.05 corrected). (B) Right amygdala activity to each condition displaying a significant signal increase to face-masked fearful vs happy eye whites, as well as signal decrease to pattern-masked fearful vs happy eye whites. Spherical ROI with a 3-mm radius was defined around the peak voxel and average parameter estimates were extracted. Error bars represent the standard error of the mean.

