
Fig. 4.
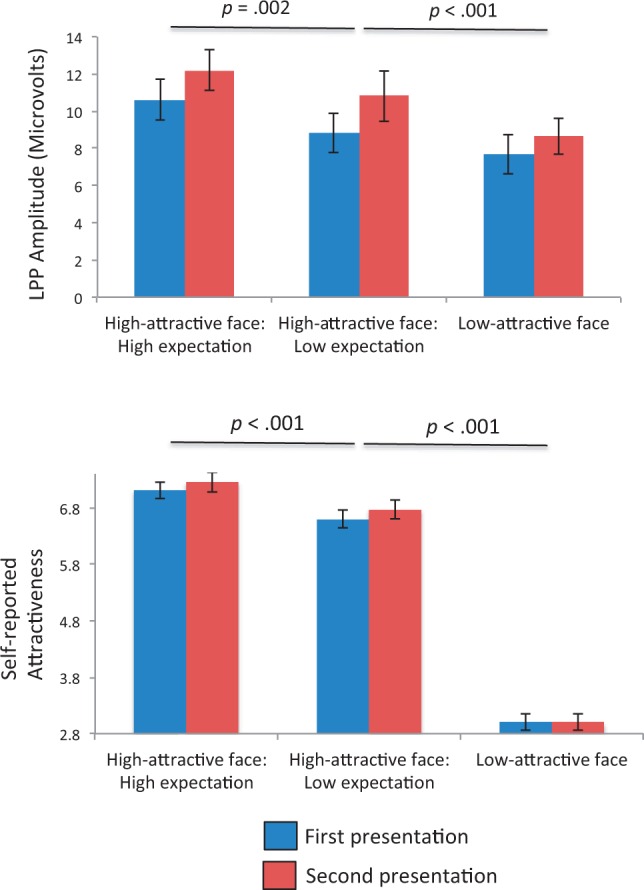
LPP amplitudes (top) and self-reported attractiveness (bottom) for the first and second presentation of each trial. Error bars reflect SEM. The P-values for pairwise comparisons between trial types are shown above the relevant bars.
Official websites use .gov
A
.gov website belongs to an official
government organization in the United States.
Secure .gov websites use HTTPS
A lock (
) or https:// means you've safely
connected to the .gov website. Share sensitive
information only on official, secure websites.
LPP amplitudes (top) and self-reported attractiveness (bottom) for the first and second presentation of each trial. Error bars reflect SEM. The P-values for pairwise comparisons between trial types are shown above the relevant bars.