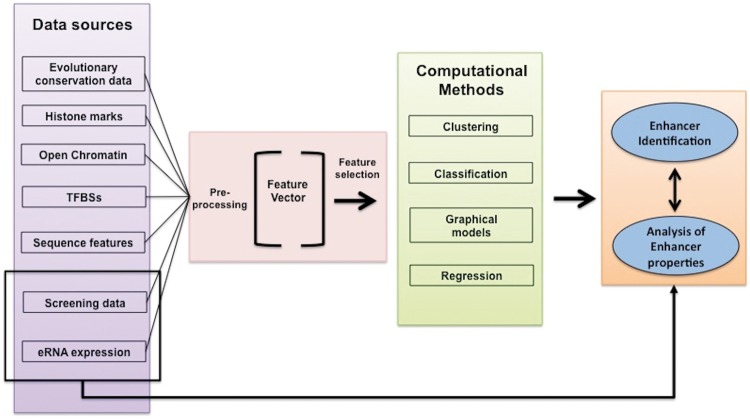
Figure 1.
This figure shows basic components of a general enhancer identification system. The first block on the left (lille colour) handles integration and preprocessing of different data types. These data types (summarized in Table 2) can be combined in different ways to generate feature vectors that describe DNA regions. The feature values can be normalized or rescaled (second block-red colour). Then, FS techniques can be applied to reduce the number of features and select smaller sets of features with higher discriminative capabilities. The feature vectors feed computational models that make decisions using unsupervised and/or supervised algorithms (third block-green colour). Outcome is a list of identified enhancer regions (fourth block-orange colour), which can be analysed further using computational techniques.

