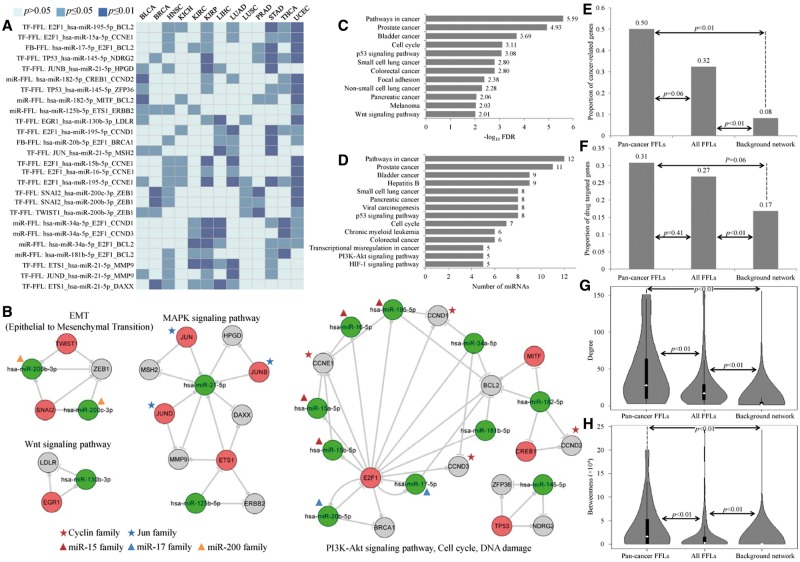
Figure 4.
Pan-cancer FFLs and their functional analysis. (A) Pan-cancer FFLs and their significance in different tumor types. Light blue, blue and dark blue cubes represent the FFLs that were not significant (P > 0.05), significant (P ≤ 0.05) and strongly significant (P ≤ 0.01) in the corresponding tumor type. (B) Pan-cancer TF–miRNA regulatory network and the function of each highly connected subnetworks. The members of the cyclin and Jun family are marked with red and blue stars, respectively. Red, blue and orange triangles represent miR-15, miR-17 and miR-200 family, respectively. (C) The pathways that were significantly enriched with genes in pan-cancer FFLs. (D) The significant pathways that were affected by miRNAs in pan-cancer FFLs. (E) The proportion of cancer-associated genes in pan-cancer FFLs, all FFLs and background regulatory network. (F) The proportion of drug target genes in pan-cancer FFLs, all FFLs and background regulatory network. (G) The degree distribution of all nodes in pan-cancer FFLs, all FFLs and background regulatory network. (H) The betweenness distribution of all nodes in pan-cancer FFLs, all FFLs and background regulatory network. A colour version of this figure is available online at BIB online: https://academic.oup.com/bib.

