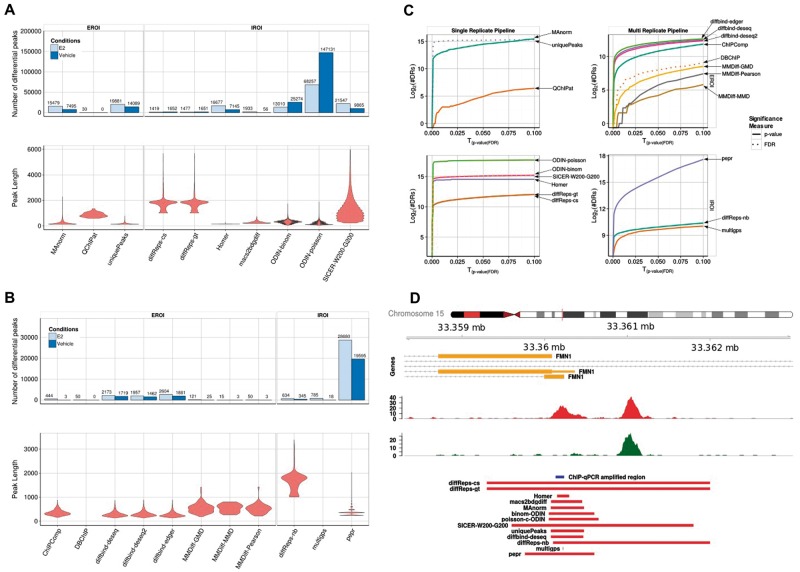
Figure 1.
Overview of the DR called by the single and multi-replicate pipelines for the FoxA1 data set: (A) Number (barplots) and size distribution (violin plots) of detected DR in each condition and size distribution for the single replicate pipeline. (B) Same as shown in A for the multi-replicate pipeline. (C) Plots showing the number of DR returned by each method as a function of the P-value threshold (plain lines) or FDR (dotted lines). (D) An example of a region, highlighting the difference between the different tools in terms of length of DR. A colour version of this figure is available online at BIB online: https://academic.oup.com/bib.

