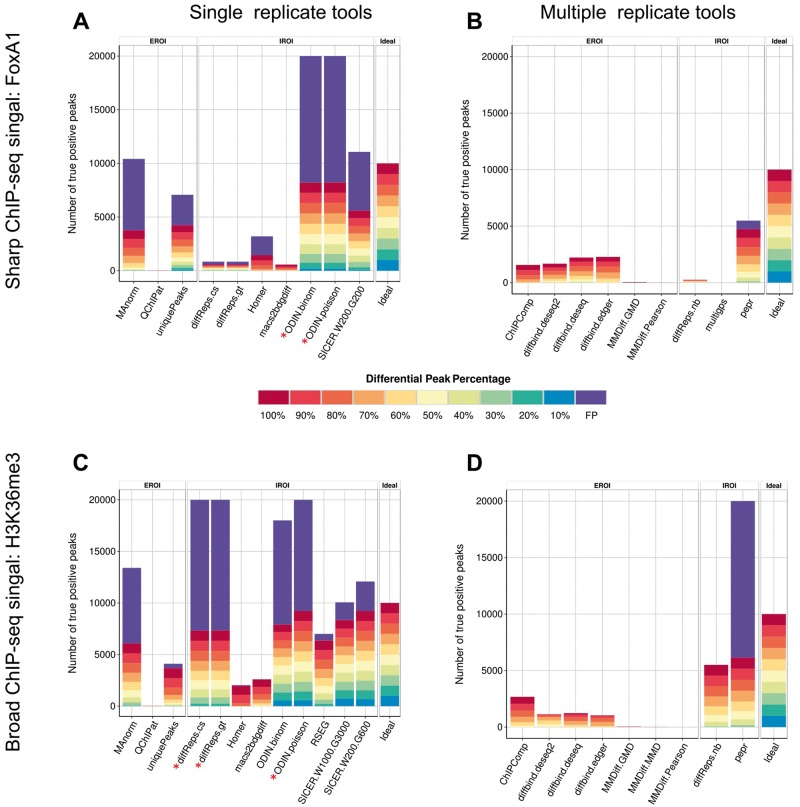
Figure 4.
Proportion of true and false positives for each tool on the simulated FoxA1 data set (A, B) and H3K36me3 data set (C, D). The percentages in the legend indicate the level of downsampling performed. A colour version of this figure is available online at BIB online: https://academic.oup.com/bib.

