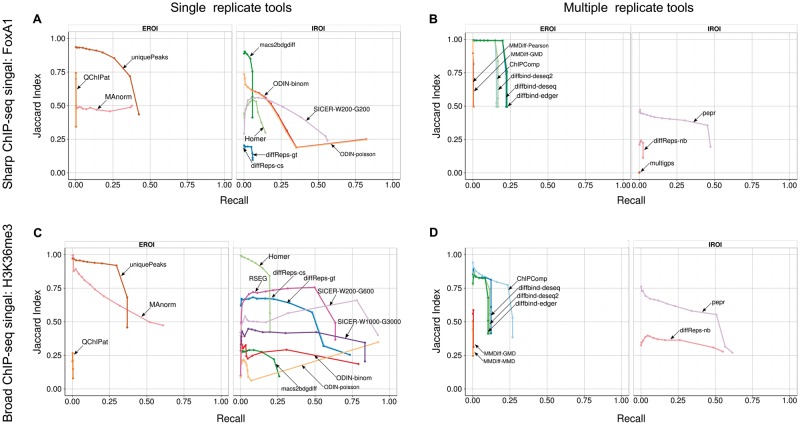
Figure 5.
JI (y-axis) and recall (x-axis) for the tools in the single replicate (left column) and multiple-replicate pipeline (right column) for the FoxA1 (A, B) and H3K36me3 (C, D) simulated data sets. We make the distinction between tools that require external regions of interest (EROI) and those that determine them internally (IROI). A colour version of this figure is available online at BIB online: https://academic.oup.com/bib.

