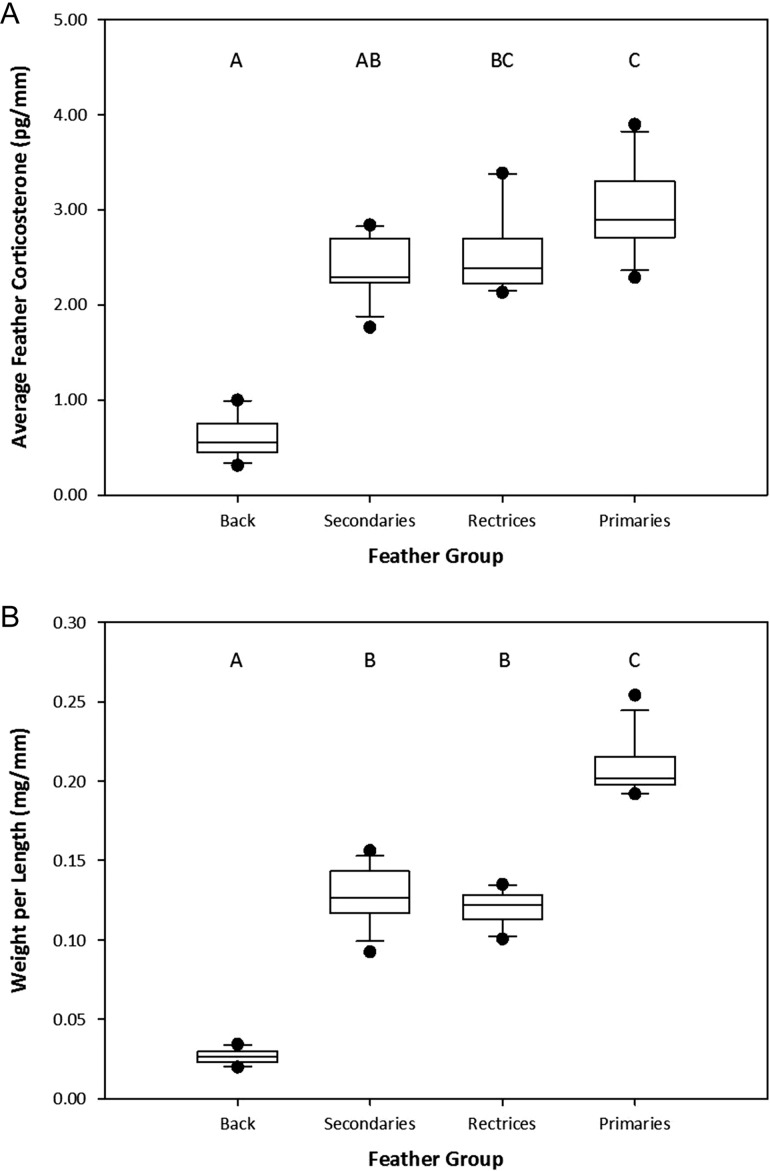
Figure 2:
(A) Box plot of average corticosterone level (in picograms per millimetre) across different types of feathers in 12 individuals. Letters denote which feather groups are significantly different by the Friedman test (χ2(3) = 30.0, P < 0.0001) blocked for individual identity. (B) Box plot of the average feather weight per unit length (in milligrams per millimetre) for different types of feathers in 12 individuals. Letters denote which feather groups are significantly different by the Friedman test (χ2(3) = 32.5, P < 0.0001) blocked for individual identity.

