
Fig. 9.
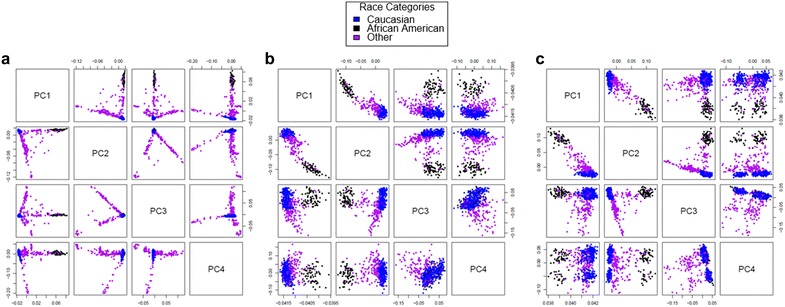
Comparison of several different methods, including gap probes, for population stratification adjustment. Points are colored according to self-reported race with Caucasian shown in blue, African American shown in black, and Other shown in purple. Each panel contains a series of plots in which the values plotted are dictated by the row (y-axis) and column (x-axis). For example the top row will plot PC 1 (y-axis) versus PCs 2, 3, and 4 (x-axis). a Eigenvectors generated from GWAS data using the EIGENSTRAT software [21]. b PCs generated from probes overlapping with 1000 Genomes-annotated SNPs (0 bp from C site option) as demonstrated by Barfield et al. [20]. c PCs generated from gap signals, which perform similarly to the existing methylation-based method to account for ancestry in EWA studies show in b