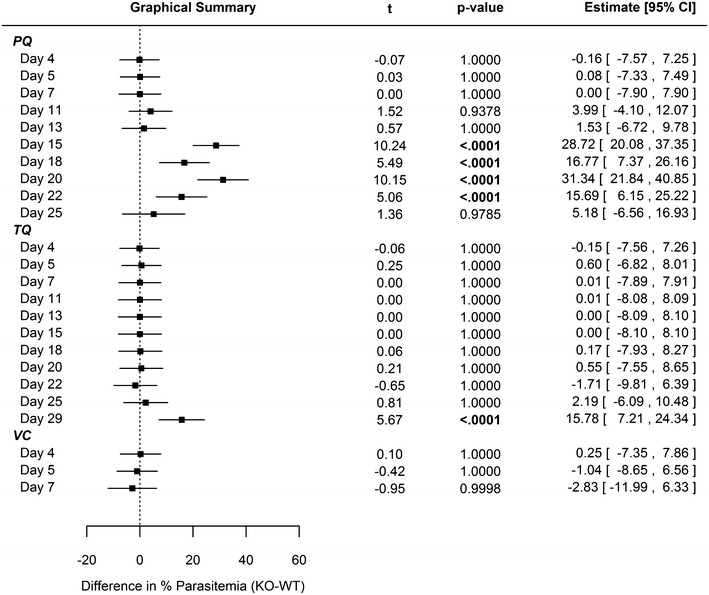
Fig. 1.

Statistical comparison regarding differences in parasitemia between WT and CYP2D KO mice. The data were modeled using linear regression with repeated measures with a spatial power law covariance structure. The model included terms for study day, treatment group, mouse strain, and all interactions between the three terms. All point estimates, intervals, and p values therefore represent the differences within each day between mouse strains after adjusting for repeated measurements on the same mice. 40 mg/kg primaquine (PQ), 25 mg/kg tafenoquine (TQ), or vehicle control (VC) administered day 4 relative to intravenous sporozoite (IV SPZ) challenge (day 0) using C57BL/6 wild-type or C57BL/6 CYP2D knock-out mice. N = 10 animals per cohort. (Refer to Additional file 1: Figure S5 for percent parasitemia)
