Fig. 1.
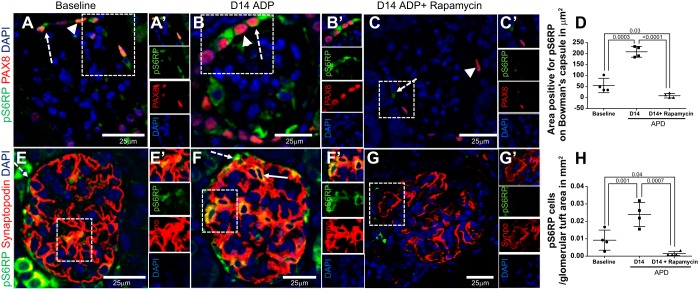
Acute podocyte depletion (APD) is associated with an increase in mTOR activity that is reduced by rapamycin. A–C: representative high-power (×400) confocal microscopy images of immunofluorescent double staining for the mTOR activity marker pS6RP (green, cytoplasmic, dashed arrow) and paired box protein 8 (PAX8) (red, nuclear, arrowhead) used to identify PECs. Nuclei are stained blue with 4′,6-diamidino-2-phenylindole (DAPI). Scale bars are provided. pS6RP (green) is shown in PECs from 10- to 12-wk-old mice at baseline (A) and day 14 of experimental APD (D14 APD; B), and D14 APD mice given rapamycin 8 mg/kg ip daily, started at D5 to death at D14 (D14 APD + rapamycin; C). The boxes in A–C show a magnified image (A′, B′, C′), and single channels are shown to the right of each image. D: pS6RP expression in PEC is demonstrated. Graph shows that the area positive for PS6RP staining on Bowman's capsule was higher at D14 APD compared with baseline, which was reduced by rapamycin treatment. E–G: images showing high-power (×400) confocal microscopy images of immunofluorescent double staining for pS6RP (green, cytoplasmic, dashed arrow) and synaptopodin (red, cytoplasmic) used to demarcate podocytes within glomerular tuft. Nuclei are stained blue with DAPI. Scale bars are provided. pS6RP (green) is colocalized within podocytes expressing synaptopodin (red) and appears as yellow (solid arrow) at baseline (E) and D14 APD (F), but is reduced in D14 APD mice given rapamycin (G). The boxes in E–G show a magnified image (E′, F′, G′), and single channels are shown to the right of each image. H: graph showing that the number of cells staining positive for pS6RP in the glomerular tuft area was higher at D14 APD compared with baseline and was reduced by rapamycin treatment.

