Fig. 3.
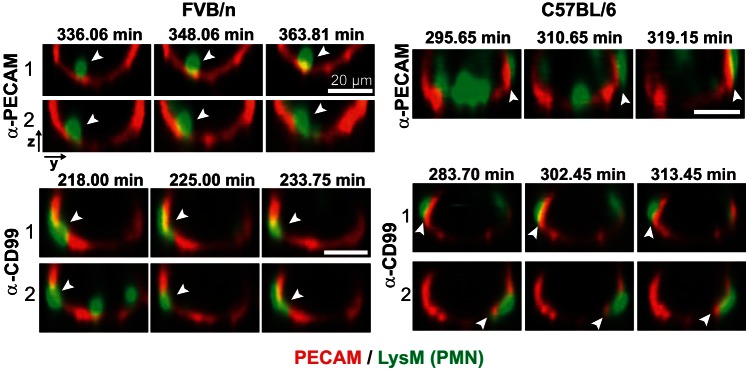
Orthogonal views of arrested leukocytes during PECAM and CD99 blockade in vivo in real time. Time-lapse recordings shown in Fig. 2 were examined to identify leukocytes that appeared arrested for long durations. Images show orthogonal views taken along the dashed lines in Fig. 2 for FVB/n or C57BL/6 mice treated with anti-PECAM or anti-CD99 MAb. Arrows denote leukocytes that appear to be arrested apically or partially in the junction (for FVB/n mice treated with anti-PECAM and anti-CD99 MAb, respectively) or beneath the endothelium (for both MAb treatments in C57BL/6 mice). Scale bar = 20 μm. Time stamp denotes time after intrascrotal cytokine stimulation.

