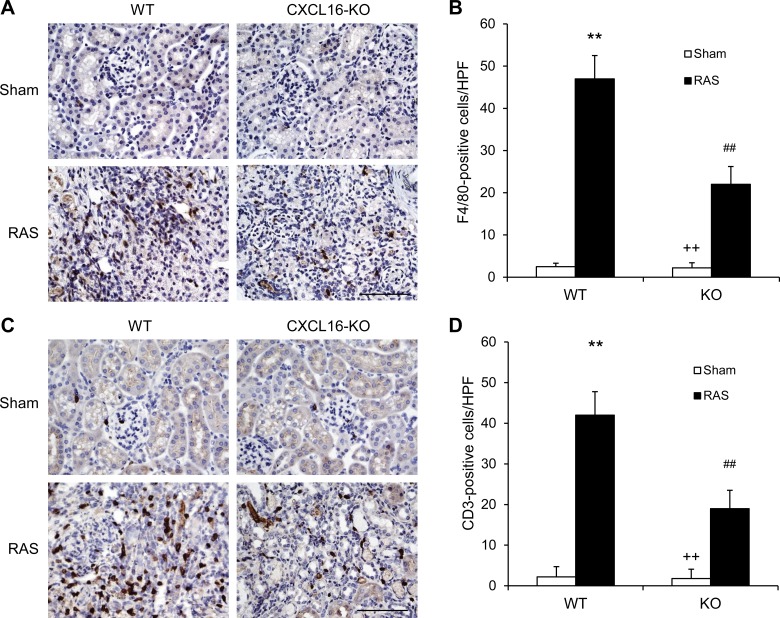
Fig. 6.
CXCL16 deficiency reduces macrophage and T-cell infiltration. A: representative photomicrographs of kidney sections stained for F4/80 (a macrophage marker; brown) and counterstained with hematoxylin (blue) in WT and CXCL16 KO mice 4 wk after sham or RAS. Scale bar, 50 μm. B: quantitative analysis of F4/80+ macrophages in the kidneys of WT and CXCL16 KO mice. Values are means ± SE; n = 6 in each group. **P < 0.01 vs. WT controls. ##P < 0.01 vs. WT RAS. ++P < 0.01 vs. KO RAS. C: representative photomicrographs of kidney sections stained for CD3 (a T-lymphocyte marker; brown) and counterstained with hematoxylin (blue) in WT and CXCL16 KO mice 4 wk after sham or RAS. Scale bar, 50 μm. D: quantitative analysis of CD3+ T cells in the kidneys of WT and CXCL16 KO mice. Values are means ± SE; n = 6 in each group. **P < 0.01 vs. WT controls. ##P < 0.01 vs. WT RAS. ++P < 0.01 vs. KO RAS.

