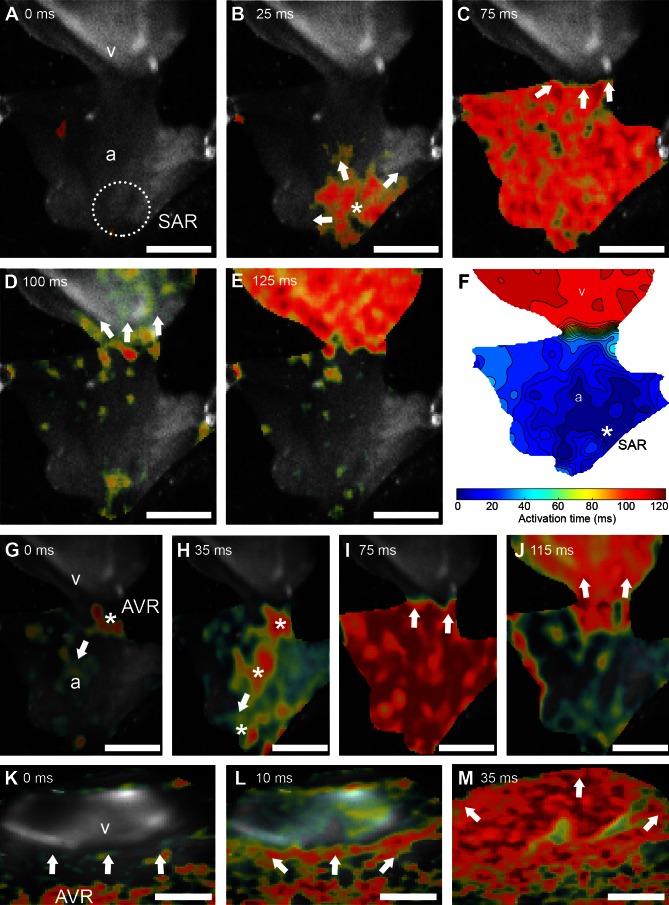
Fig. 3.
Optical mapping of origin and spread of excitation in atrium and ventricle. A–E: sequence of images showing progression of depolarization from the region of origin in the SAR (* in A) into the atrial wall (a in B and C) across the atrioventricular junction (D) and into the ventricle (v in E). Arrows indicate the direction of propagation of the main excitation wavefront. F: isochronal map (isochrones = 8 ms) summarizing the regional spread of electrical activity from the site of origin (*) in the SAR, across the atrium, and into the ventricle. Color scale represents time to activation from initial excitation. G–J: sequence of images showing progression of depolarization during simultaneous stimulation of both cardiac VSN rami, demonstrating a shift in the site of origin toward the AVR. Arrows indicate direction of propagation. The site of first depolarization occurred at the AVR (* in G), followed by multiple foci outside of the SAR (* in H) which depolarized the atrium (I). After a delay at the AVR (I), the depolarizing activity invaded the ventricle (J). K–M: sequence of images showing progression of depolarization from the AVR into the ventricle after surgical isolation from the atrium (K). The main excitation wavefront initiated in the AVR (L) and propagated through the ventricle (M). Scale bars = 1 mm (A–J) and 50 μm (K–M).

