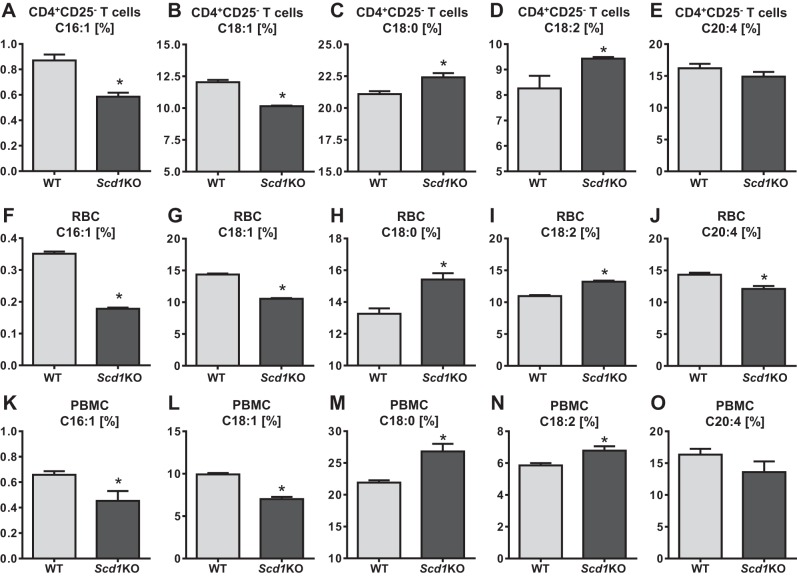
Fig. 6.
Scd1KO CD4+CD25− T cells, RBCs, and peripheral blood mononuclear cells (PBMCs) exhibited altered fatty acid composition. CD4+CD25− T cells, RBCs and PBMCs from 4-wk-old female Scd1KO mice and WT littermates (n = 4) were analyzed for their lipid composition via gas chromatography. Fatty acid compositions are expressed as percentage of the total fatty acids analyzed. Bar graph represents fatty acid profile of CD4+CD25− T cells: C16:1 (A), C18:1 (B), C18:0 (C), C18:2 (D), and C20:4 (E). Bar graph represents fatty acid profile of RBCs: C16:1 (F), C18:1 (G), C18:0 (H), C18:2 (I), and C20:4 (J). Bar graph represents fatty acid profile of PBMCs: C16:1 (K), C18:1 (L), C18:0 (M), C18:2 (N), and C20:4 (O). Results expressed as mean ± SE. *P < 0.05, unpaired t-test.

