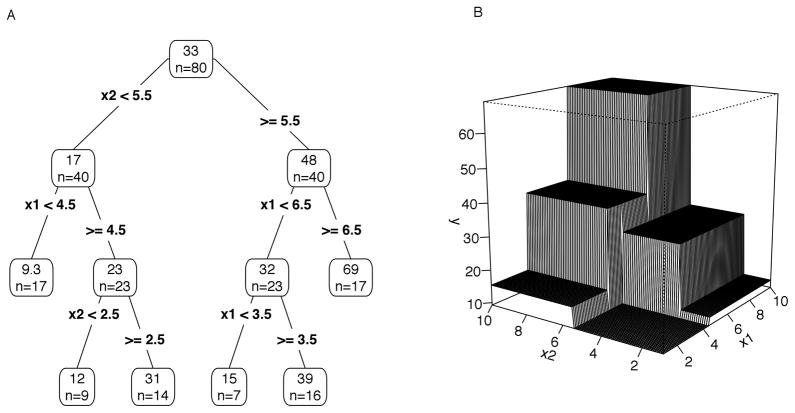
Figure 1.
Representation of a decision tree as a tree diagram (Panel A) and as a surface in three dimensions for two predictors (Panel B). In the decision tree (Panel A) the means (top) and sample sizes (n = …) within each node are shown, and the split is shown in each branch. Panel B illustrates that decision trees are piecewise-constant approximations of nonlinear and interaction effects: each split divides the predictor space into rectangular regions, and the prediction of the tree is the mean of the response variable in each region. Plots following Hastie et al. (2009), Elith (2008), and many others.

