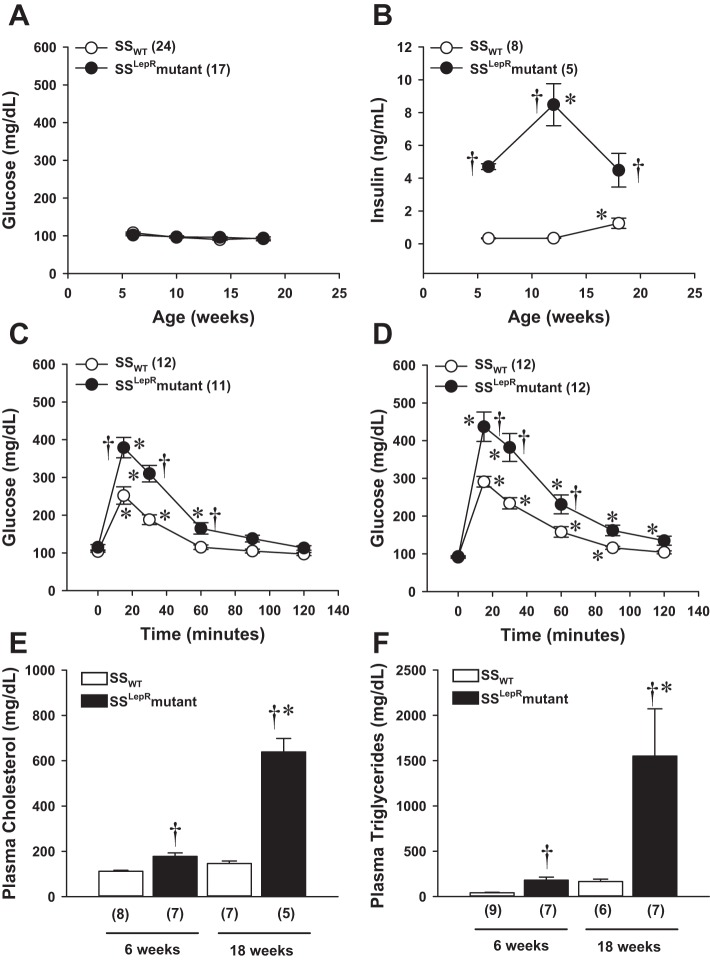
Fig. 2.
Comparison of time course measurements of blood glucose and plasma insulin levels (A and B), the progression of impaired glucose tolerance by IPGTT (C and D), and plasma cholesterol and triglyceride levels (E and F) in SSWT rats and the SSLepRmutant strain. Numbers in parentheses indicate the number of rats studied per group. Values are means ± SE. *Significant difference from the corresponding value within the same strain at baseline (P < 0.05). †Significant difference from the corresponding value in SSWT rats (P < 0.05).

