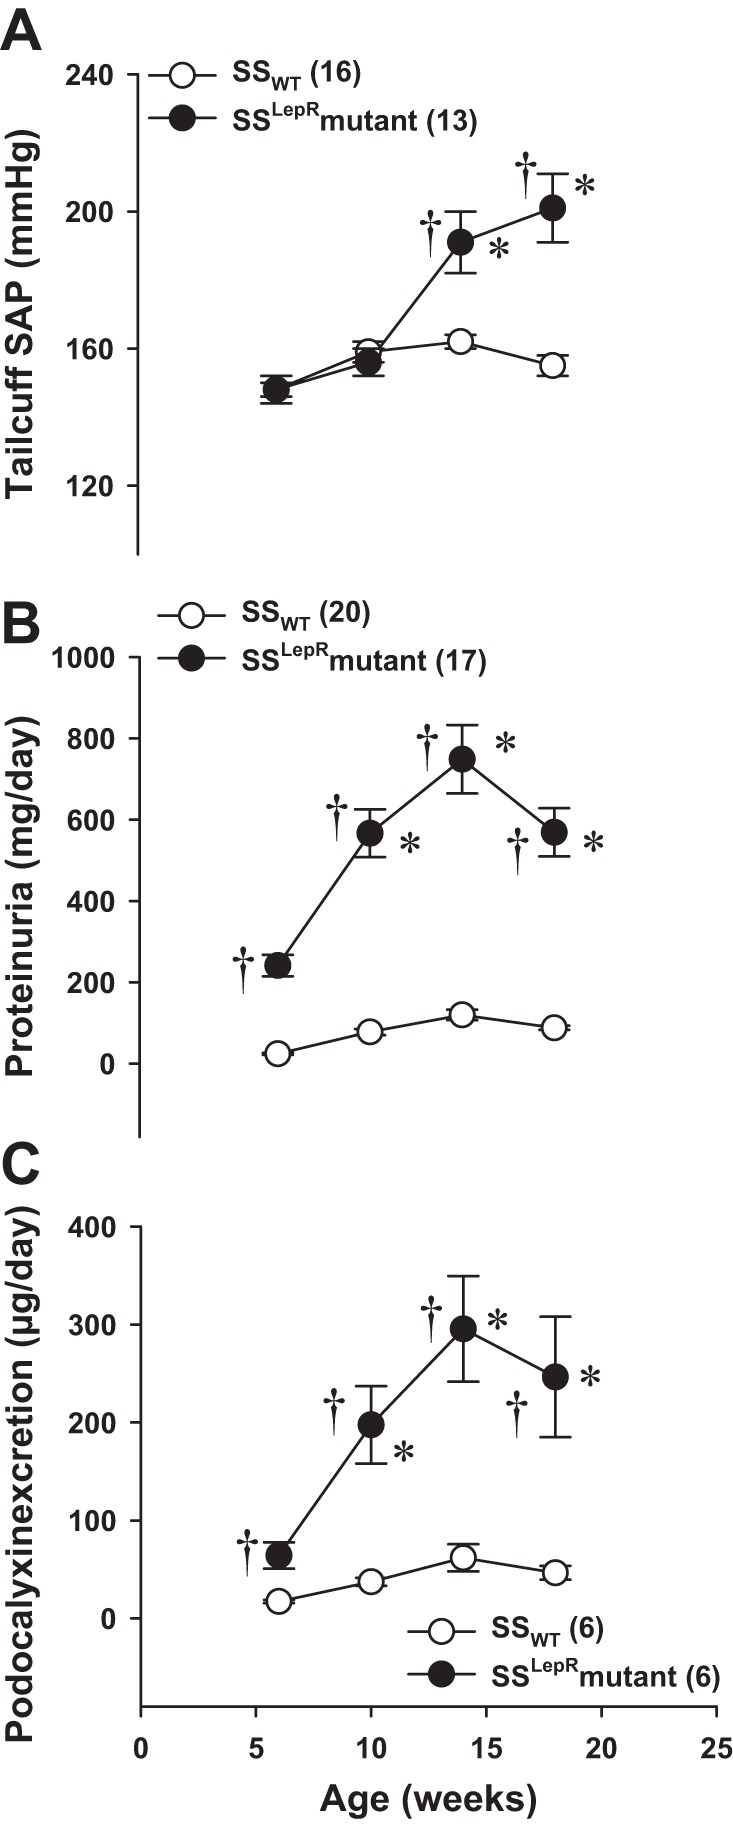
Fig. 3.

Time course measurements of systolic arterial pressure (SAP; A), protein excretion (B), and podocalyxin excretion (C), a marker of podocyte injury, in SSWT rats and the SSLepRmutant strain. Numbers in parentheses indicate the number of rats studied per group. Values are means ± SE. *Significant difference from the corresponding value within the same strain at baseline (P < 0.05). †Significant difference from the corresponding value in SSWT rats (P < 0.05).
