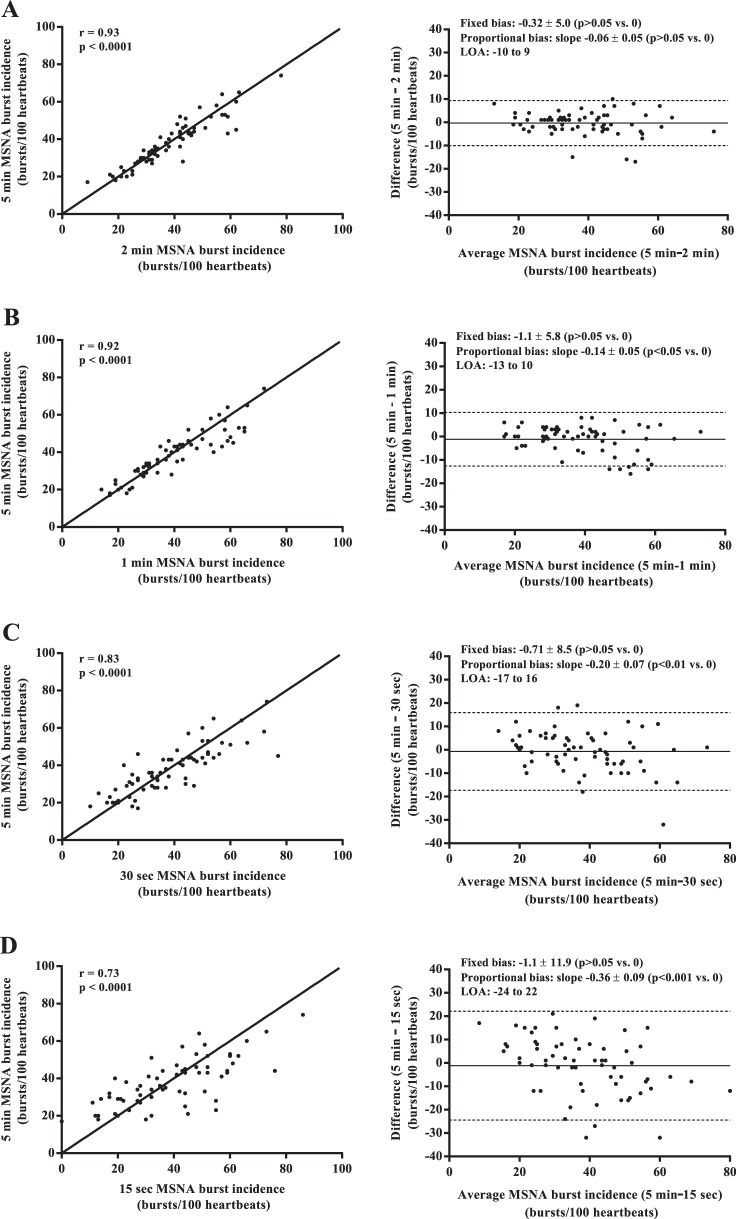
Fig. 3.
Regression analyses (left column) and Bland-Altman plots (right column) comparing muscle sympathetic nerve activity (MSNA) burst incidence measured from the 5-min control and the 2-min (A), 1-min (B), 30-s (C), and 15-s (D) sampling durations. The solid lines in the regression analyses represent the line of identity.

