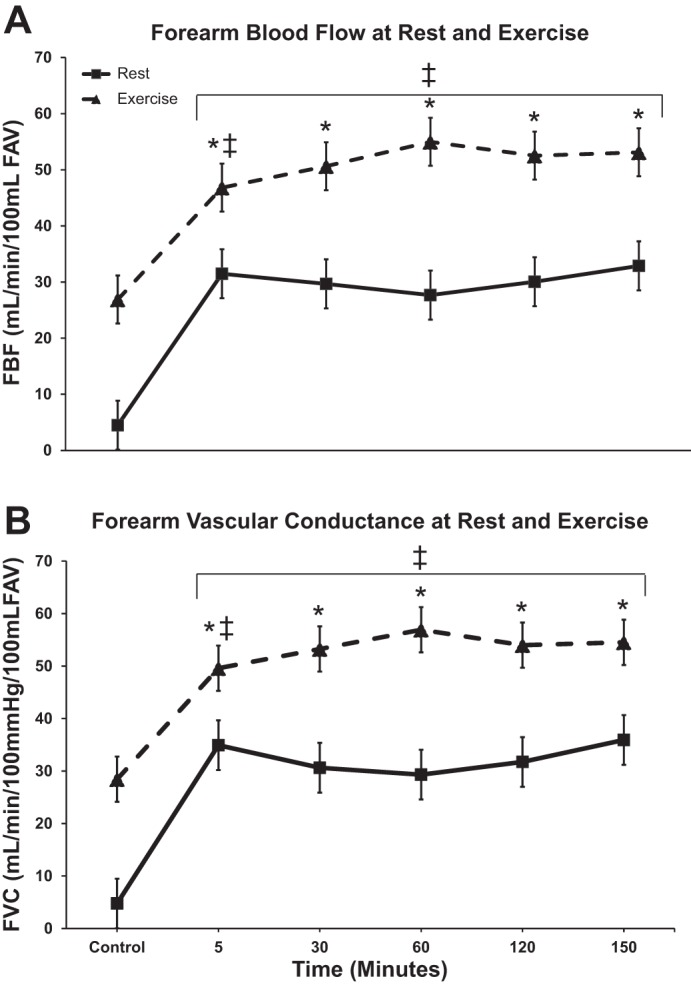
Fig. 3.

Forearm blood flow (FBF) and forearm vascular conductance (FVC) responses. FBF (A) and FVC (B) during the ATP infusion over time, showing rest and exercise responses. Values are expressed as means ± SE for all nine subjects. *P < 0.05 vs. control rest. ‡P < 0.05 vs. resting measurement. Note “control” occurs during the saline infusion, while time points 5–150 min occur during the ATP infusion.
