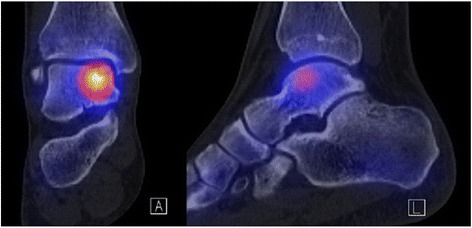
Fig. 2.

SPECT/CT of an ankle with an OCL on the talus dome. The left picture represents the coronal view, the right picture the sagittal view. Yellow indicates the highest activity in the bone, whereas in the tibia and the other foot bones the individual and physiological bone activity is shown as a light blue
