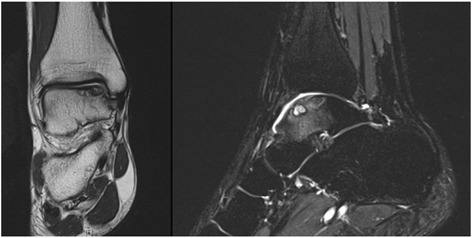
Fig. 3.

OCL at the medial talar dome is shown on MRI. Left: Proton-density-weighted coronal image shows a subchondral cystic area of the medial talar dome with adjacent cartilage defect. Right: T2-weighted fat-saturated sagittal image: Subchondral cystic lesion with surrounding bone marrow edema pattern of the talar body
