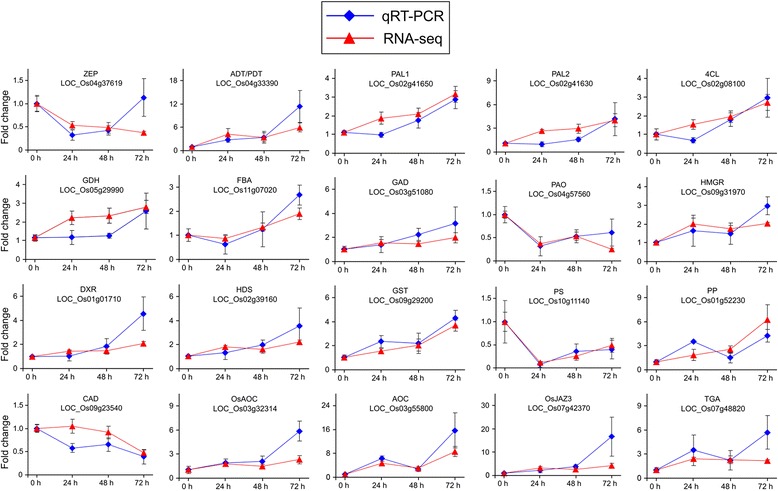
Fig. 2.

Comparison of mRNA expression levels detected by RNA-seq (solid triangles) and qPCR (solid squares) for 20 selected genes. All qPCR data were normalized against the housekeeping gene ubiquitin 5. Values are means ± SE; n = 4 for RNA-seq and n = 3 for qRT-PCR. ZEP, zeaxanthin epoxidase; ADT/PDT, arogenate/prephenate dehydratase; PAL, phenylalanine ammonia-lyase; 4CL, 4-coumarate-CoA ligase; GDH, glutamate dehydrogenase; FBA, fructose-bisphosphate aldolase, class I; GAD, glutamate decarboxylase; PAO, polyamine oxidase; HMGR, hydroxymethylglutaryl-CoA reductase; DXR, 1-deoxy-D-xylulose 5-phosphate reductoisomerase; HDS, 4-hydroxy-3-methylbut-2-enyl diphosphate synthase; GST, glutathione S-transferase; PS, phytoene synthase; PP, phosphatase; CAD, cinnamyl-alcohol dehydrogenase; AOC, allene oxide cyclase; JAZ, jasmonate ZIM domain-containing protein; and TGA, TGACGTCA cis-element-binding protein
