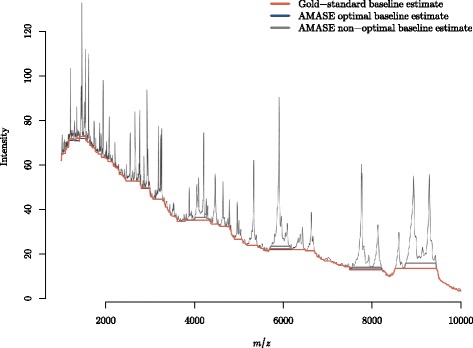
Fig. 8.

Optimised automated baseline estimate (blue) compared to the gold-standard (orange) piecewise baseline estimate for the Fiedler spectrum. The optimal transformation and EPCP were t 3 and 0.98, respectively. A non-optimal transformation (grey) is provided for reference, for which the corresponding transformation and EPCP are t 4 and 0.95, respectively
