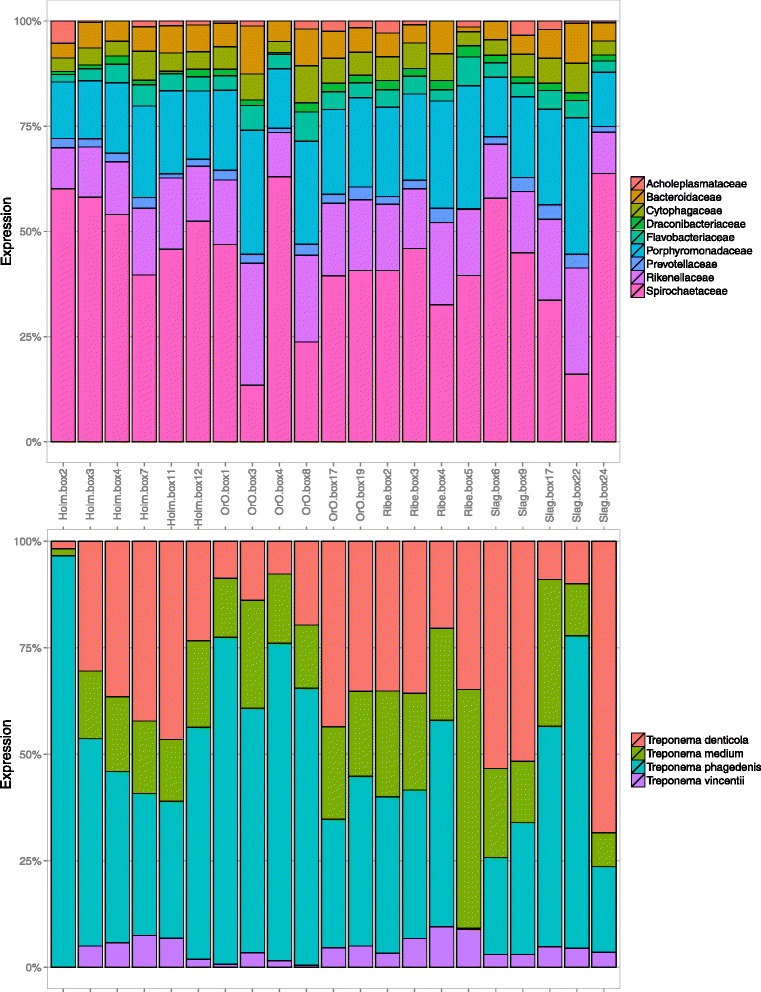
Fig. 3.

Taxonomic composition of the samples. The family (a) and species (b) compositions of the bacterial transcripts identified in the samples. The expression has been estimated as the sum of the reads mapped on all transcripts annotated with a given taxonomic unit. Unmapped reads and transcripts with no taxonomic annotation are not displayed
