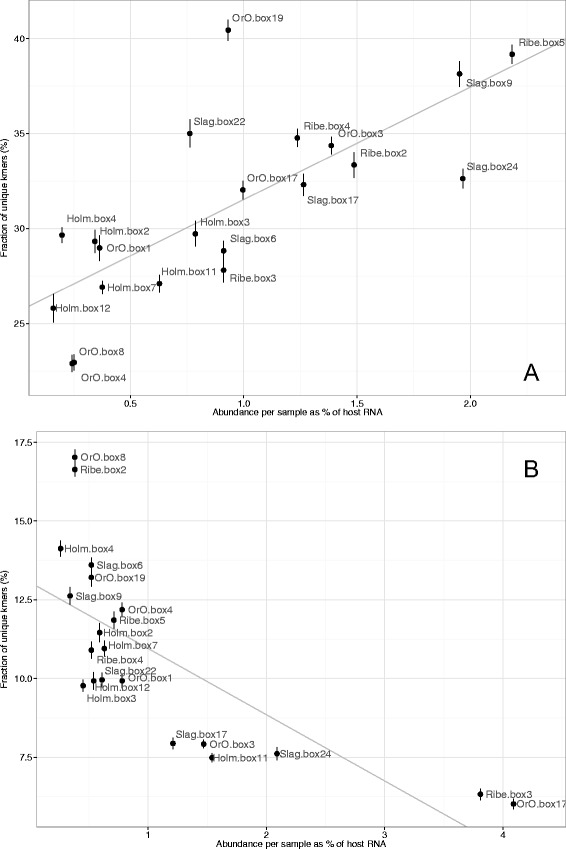
Fig. 5.

Diversity vs abundance in the samples. Abundance is calculated as the ratio between reads that map on the bacterial (panel a) and antibody (panel b) transcripts and the reads that map on the cow genome. Diversity is defined in panels a and b as the average percentage of unique k-mers for every 500 000 k-mers extracted from the bacterial and antibody reads. Regression lines are displayed in grey (panel a Pearson correlation = 0.75, p-value = 9.1e-5; panel b Pearson correlation = -0.73, p-value = 0.0017). Bars indicate ±1 standard deviation, calculated over 10 k-mers extractions
