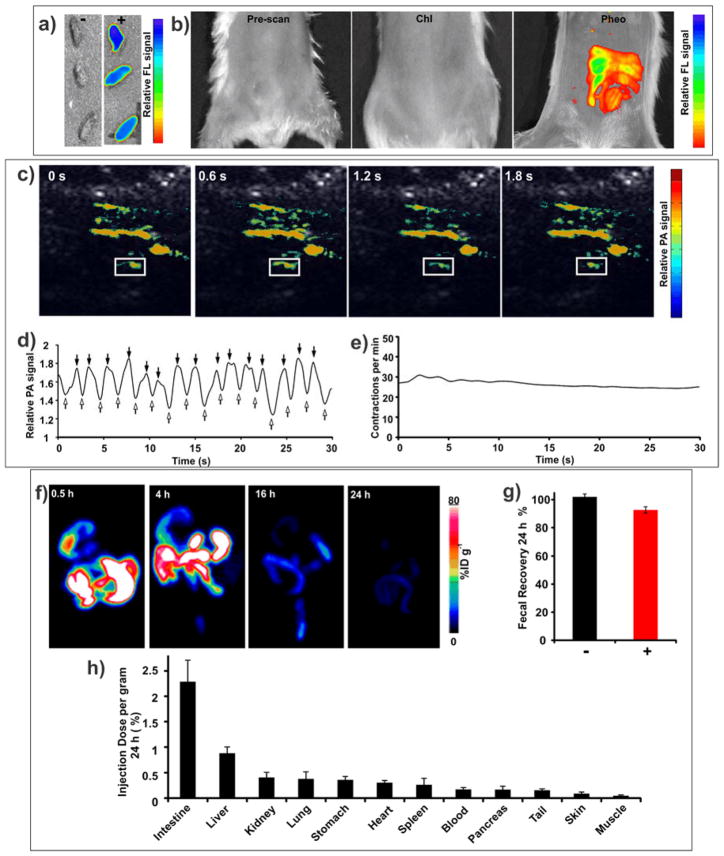
Figure 3. Trimodal imaging of intestine using Pheo ss-InFroMs.
a) Fluorescence images of feces with and without administration of 100 O.D. Pheo ss-InFroMs. b) Fluorescence images of intestine after gavage of PBS (left), 100 O.D. of Chl ss-InFroMs (middle) or 100 O.D. of Pheo ss-InFroMs (right). c) Photoacoustic images of the gut after gavage of 100 O.D. of Pheo ss-InFroMs. Photoacoustic signal is shown in color overlaid on ultrasound gray scale images. d) Fluctuation of photoacoustic signal in the region of interest (ROI, indicated by white boxes in Fig. 3c). First derivative zero crossings show the time of maximal photoacoustic contrast inflow and outflow points as indicated by solid and hollow arrows, respectively. e) Rate of contractile motion within indicated ROI, plotted over time. f) Representative maximum intensity projection PET images of 64Cu Pheo ss-InFroMs at different time points. g) Fecal clearance of Pheo ss-InFroMs based on Pheo itself or chelated 64Cu in mice 24 h after gavage of 100 O.D. of contrast agent. h) Biodistribution of [64Cu] Pheo ss-InFroMs 24 h after gavage of 100 O.D. Pheo ss-InFroMs. Most [64Cu] in Pheo ss-InFroMs was cleared in feces. Low amounts 64Cu found in organs were probably caused by a small amount of 64Cu displacement from Pheo.

