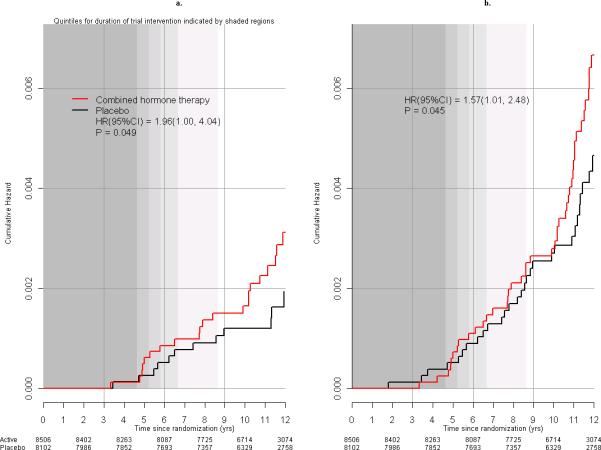
Figure 4.

Deaths after breast cancer in the WHI clinical trial. Kaplan Meier cumulative hazard curves for: A) deaths directly attributed to breast cancer by study group and time since randomization and B) deaths from all causes following a breast cancer diagnosis, by study group and time in the trial. Hazard ratios (HRs), 95% confidence intervals (CI) and P values are from Cox regression models, stratified by age (5 year intervals) and randomization assignment in the WHI Dietary Modification trial. Quintiles for duration of study intervention (elapsed time from randomization, until the intervention stopped on July 8, 2002) are indicated by the progressive shaded regions. For example, 80%, 60%, 40% and 20% of participants were in the intervention for at least 4.6 years, 5.2 years, 5.8 years and 6.7 years, respectively. All women stopped the intervention by 8.6 years.
