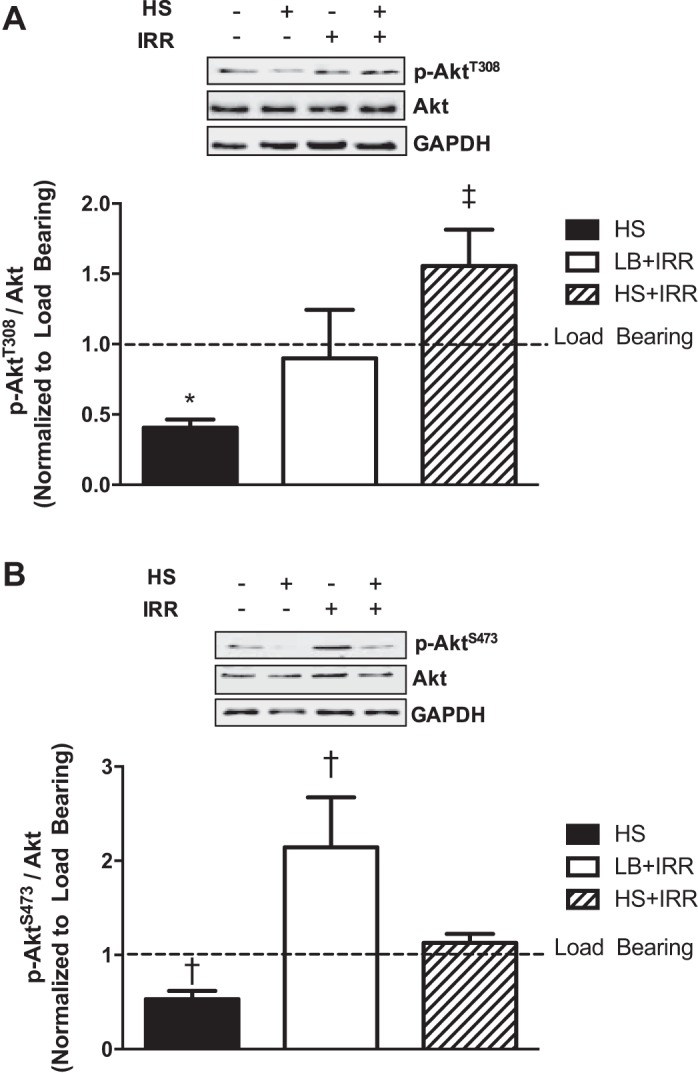
Fig. 2.

Akt phosphorylation in response to unloading and irradiation. A: representative immunoblots of AktT308, total Akt, and GAPDH in gastrocnemius muscle (top); quantification of phosphorylated to total Akt protein expression (bottom). B: representative immunoblots AktS473, total Akt, and GAPDH in gastrocnemius muscle (top); quantification of phosphorylated to total Akt protein expression (bottom). All samples were run on the same gel. Values are means ± SE. Statistical significance was set at P < 0.05. Data are normalized to LB controls. *Significantly different from LB; †significantly different from all groups; ‡significantly different from HS.
