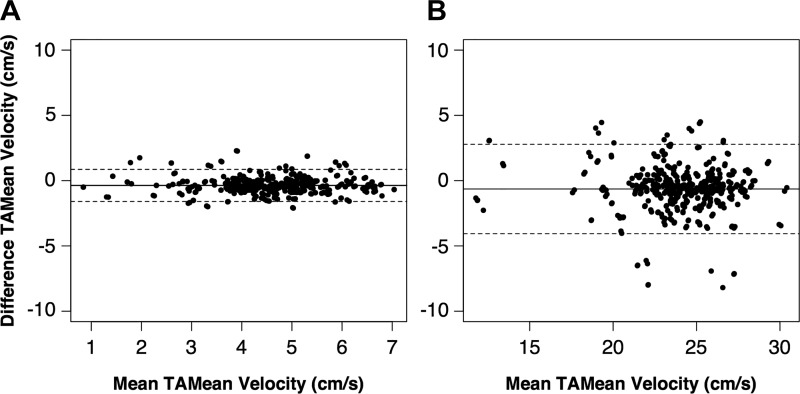
Fig. 5.
Automated and manually assessed time-averaged mean (TAMean) velocity values (cm/s) were equivalent for both resting (A) and postcontraction (B) cardiac cycles. The center solid line represents the mean difference (auto − manual), and the outer dashed lines show the 95% limits of agreement on each Bland-Altman plot. Note the increased x-axis range for the postcontraction data.

