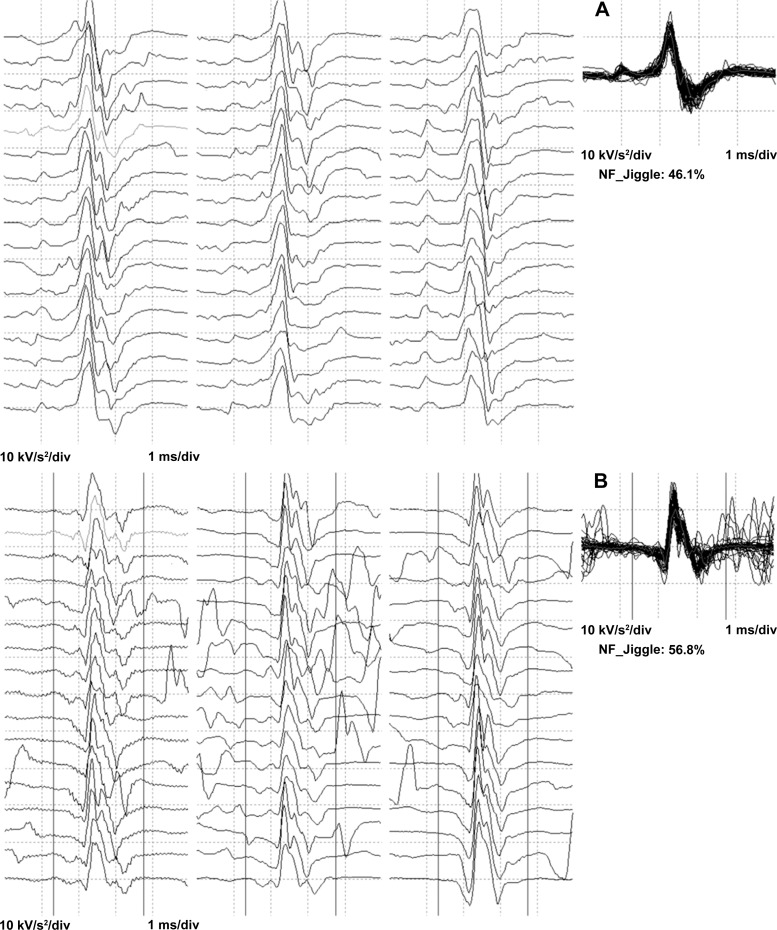
Fig. 1.
Exemplar data of near fiber MUPTs raster plots created from accelerated data from a subject in the MA group (A) and one in the control group (B). The rasters show sequential firings of motor unit potentials. The NF MUP shimmer plots are an overlay of MU firings from a single MU. NF jiggle values are presented as a percentage.

