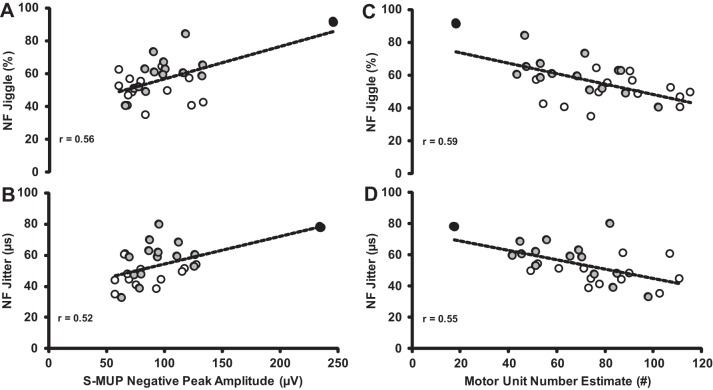
Fig. 3.
Relationships between NF jiggle (A), NF jitter and S-MUP (B), NF jiggle (C), and NF jitter and MUNE (D) between MA (open circles) and age-matched controls (gray circles). All relationships were statistically significant (P < 0.01). The participant (88 yr) with the largest mean S-MUP had the lowest MUNE count and also had the highest values for NF jiggle and second highest for NF jitter (black circles). Removing this participant reduces the “r” values slightly, but statistical significance is maintained.

