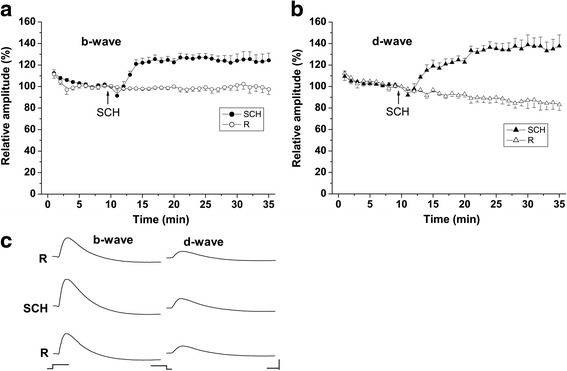
Fig. 1.

Effects of SCH 23390 on the ERG waves a, b Time course of the effects of SCH 23390 on the amplitudes of the ERG b- and d-waves. Results of both control experiments (R, open symbols) and test experiments (SCH, filled symbols) are represented. The amplitudes of the ERG waves were normalized to the values obtained in the 10th minute from the beginning of the experiments. The time when the perfusion was switched to 75 μM SCH 23390 (SCH) are indicated by arrows. Mean values ± SEM are shown. c Original ERG records (b- and d-wave) obtained during the perfusion with Ringer solution (R) in the control period (10th minute from the beginning of the experiment - upper row), 75 μM SCH 23390 (21st minute from the beginning of the experiment - middle row) and Ringer solution (R) in the recovery period (50th minute from the beginning of the experiment - bottom row). The stimulus onset and offset are indicated below the traces. Calibration: time – 0.2 s; amplitude – 50 μV
