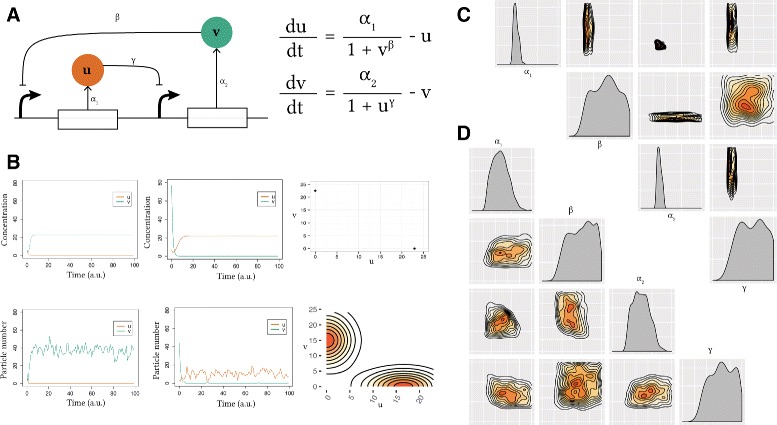
Fig. 2.

Analysis of the Gardner switch model. a The model consists of two mutually repressing transcription factors. It can be reduced to a two-equation system, where u and v are the concentrations of transcription factors 1 and 2, α 1, α 2 are their effective rates of synthesis, and β, γ represent the cooperativity of each promoter. b Two samples of deterministic simulated time courses of the Gardner switch and the resulting phase plot and two samples of time courses of the stochastic simulations and the resulting stationary distributions. c, d The deterministic c and stochastic d posterior distributions. These include the one dimensional marginal density plots on the diagonal, and the two dimensional marginal distributions on the off-diagonal. All densities are plotted on the prior range
