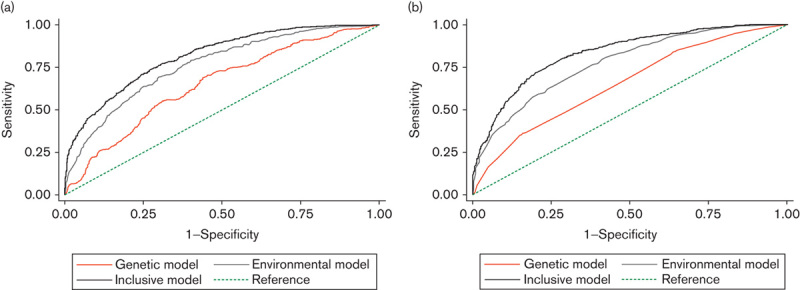
Fig. 1.

Receiver operating characteristic curves in the three risk models for upper aerodigestive tract cancer in the derivation study (a) and the validation study (b). The straight dashed line with an area under the curve of 50% is the reference. The upper black curved line represents the inclusive risk model, the gray line represents the environmental model, and the orange line represents the genetic model.
