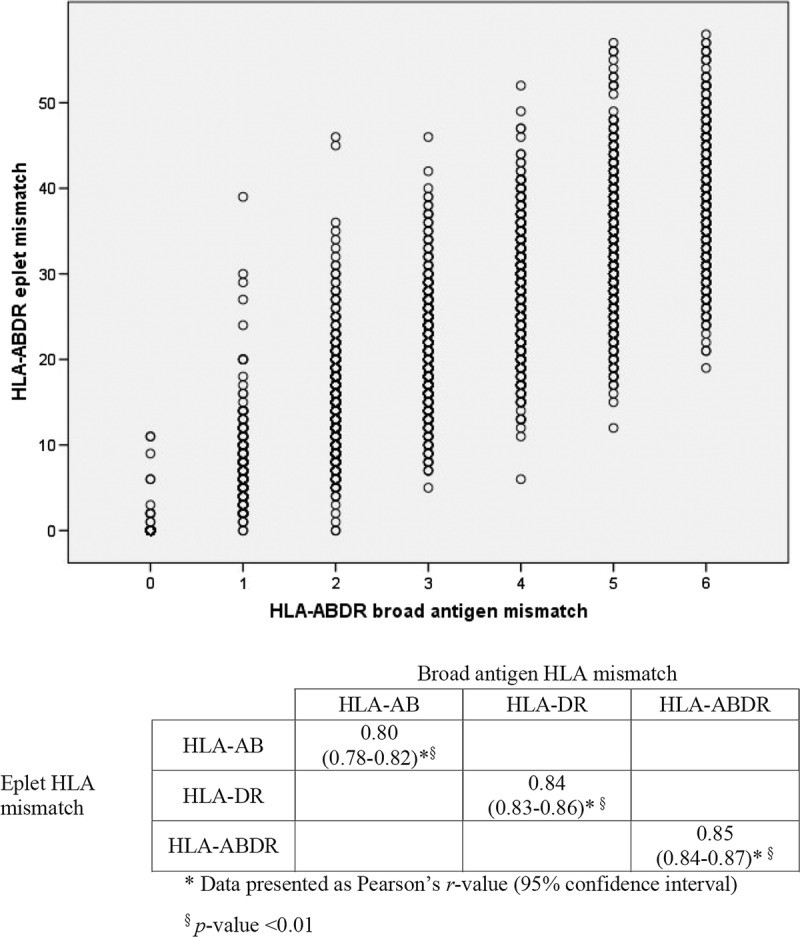
FIGURE 2.

Scatter plot of correlation between broad antigen and eplet HLA mismatches by HLA class I (HLA-A and HLA-B), class II (HLA-DR) and combined class I & II (HLA-ABDR) loci and associated correlation matrix showing Pearson r values.

Scatter plot of correlation between broad antigen and eplet HLA mismatches by HLA class I (HLA-A and HLA-B), class II (HLA-DR) and combined class I & II (HLA-ABDR) loci and associated correlation matrix showing Pearson r values.