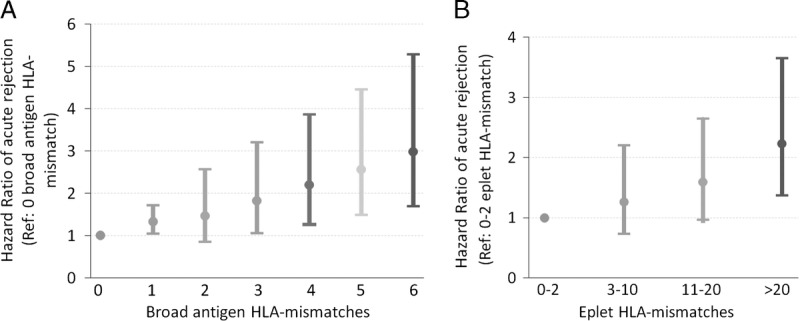
FIGURE 3.

Hazard ratio plot of adjusted rejection risk according to (A) HLA-ABDR broad antigen mismatch and (B) HLA-ABDR eplet mismatch. Logistic regression model adjusted for recipient age, sex, height, weight, waiting time on dialysis, peak PRA, donor source, donor age, gender, and use of induction therapy.
