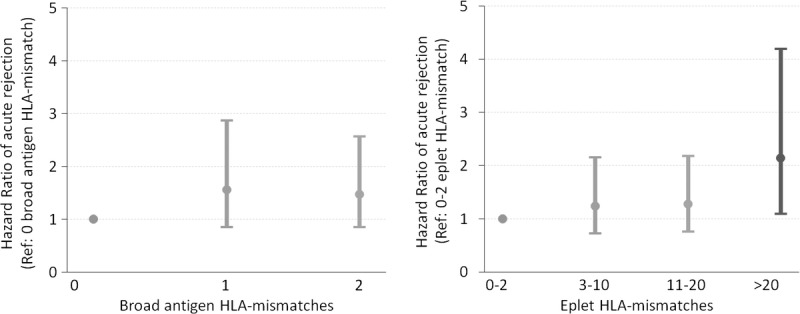
FIGURE 5.

Hazard ratio plot of adjusted rejection risk restricted to 0 to 2 broad antigen HLA-ABDR mismatches according to broad antigen and eplet HLA mismatches. Cox's proportional hazards regression model adjusted for recipient age, sex, height, weight, waiting time on dialysis, peak PRA, donor source, donor age, sex, and use of induction therapy.
