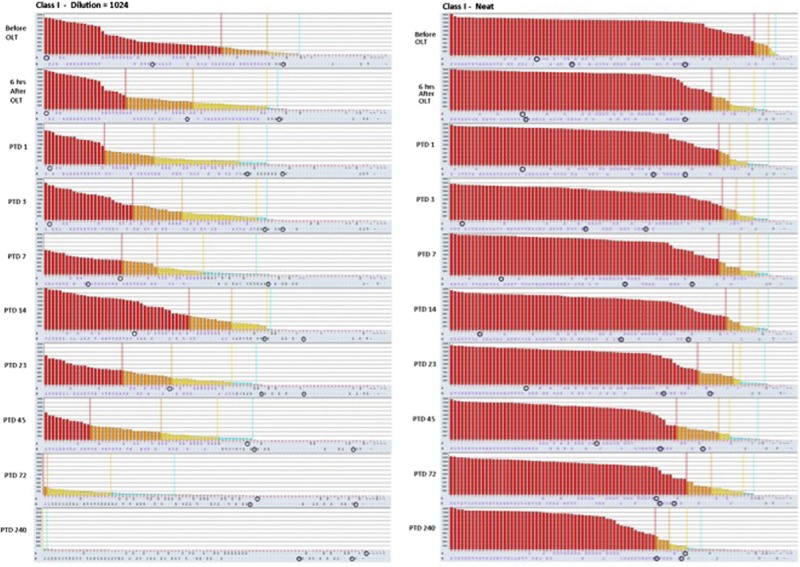
FIGURE 4.

Class I HLA antibody histograms obtained from single antigen bead assay on diluted (1:1024) and neat sera. There is a progressive reduction in class I HLA antibody MFI values, especially a month after transplantation. The DSA specificities, marked by blue circles, migrate toward the right of the plots indicating a significant reduction in MFI values.
