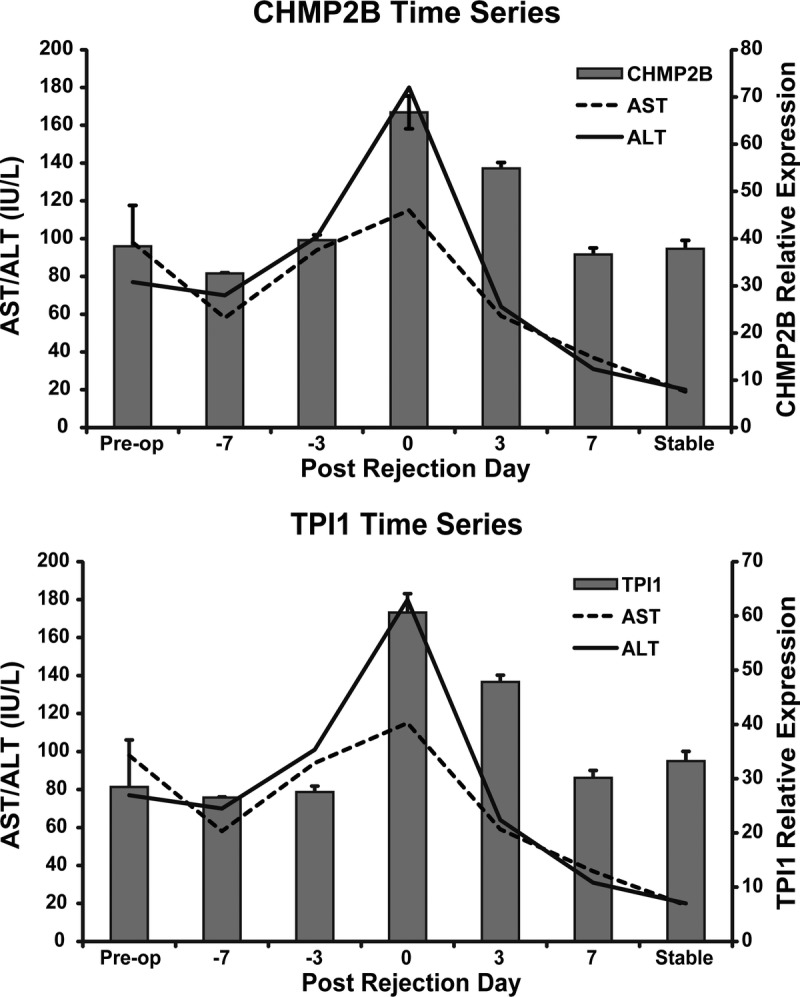
FIGURE 6.

Serial changes in the activity of autoantibody to CHMP2B and TPI1 in sera samples obtained from a single patient with ACR as measured by ELISA. ACR was diagnosed at POD 15. The band plot represents the optical density and the line plot represents liver enzyme activity. Error bars indicate standard error of the mean (SEM).
